Two cages, ~10 m apart. The front grows to a 40% open screen, the back grows solid. Water jets through the front, sloshes in the gap out of phase with the sea, and nothing gets through. The gap is tuned to the wave so little reflects either (Jarlan chamber, built since 1962). Show up, screw in anchors, hang the cages, grow for two years.
peer-reviewed published field measured on a real install derived this site input your choice
Sandbar calculator
Structure
$ per mile
Basis
Rock mound for the same bar, from Rock (Hudson, van der Meer, d’Angremond): 4 m high, 39 m²/m, 116,000 t/mile, Kt 0.26.
The setup
Two steel egg-crate cages, 4 m tall, ~10 m apart (0.1–0.3 wavelengths). Helical anchors every 3–4 m.
Titanium anodes hung in the gap. field EUDP used DSA.
Rectifiers in constant-current mode, 1.5 A per m² of steel. Volts float, 2–4 V. peer-reviewed Sharker 2023 compact limit · Goreau 2012 “1–2 cm/yr, no faster”.
Two years at ~2 cm/yr of limestone per side. Then drop to protection current, or off if the limestone holds alone.
The gap does the work: reflection ≤0.3 only if the gap is 0.1–0.3 wavelengths. A few feet does nothing. peer-reviewed Medina 2010 · Suh 2001.
Same sea, built projects
Our wall run at the USACE Mordecai Island design conditions: Barnegat Bay NJ, 1.5 m at MHW, 0.9 m wave, T 2.5 s, crest 0.5 m above MHW. Same job, less material, no track record.
Structure
Waves
$ per mile
Material
Robustness
Robustness is what the table cannot show. Rock and sheet pile have been in these bays for 60 years; our wall has never been built. The risks that could make ours worse:
Risk in a NJ bay
Rock mound / bulkhead
Grown wall
Winter ice pushing on it
Known. Stevens budgets 10% of build cost to re-set rock moved by ice
Untested. 5 mm steel cage with a brittle limestone skin
Soft bay mud under it
Known. USACE lays a geocomposite and builds 1 ft high to allow settlement
Untested. Held by helical anchors screwed into loose sediment; anchor capacity there is unmeasured
Scour at the toe
Mild. A 2:1 slope spreads the wave
Worse. A vertical face scours its toe, same as a bulkhead
Boat wakes
Designed for them; USACE used wakes as the design wave
Model assumes regular waves; wakes are short, steep groups. Not checked
Storm bigger than design
Rock loses stones gradually; start-of-failure at 1.3× design wave (van der Meer S 2 → 8). Bulkhead steel replaced at 40–60 yr
Water is 1.5 m, so the biggest wave is ~1.2 m and the steel never nears yield. Whether skin or anchor gives first is unknown
Track record
60+ yr, thousands of miles
None at wall scale. Biorock exists only as reef-scale mesh (History)
One test panel in Barnegat Bay through one winter answers the first four rows.
Jarlan wall — the prior art
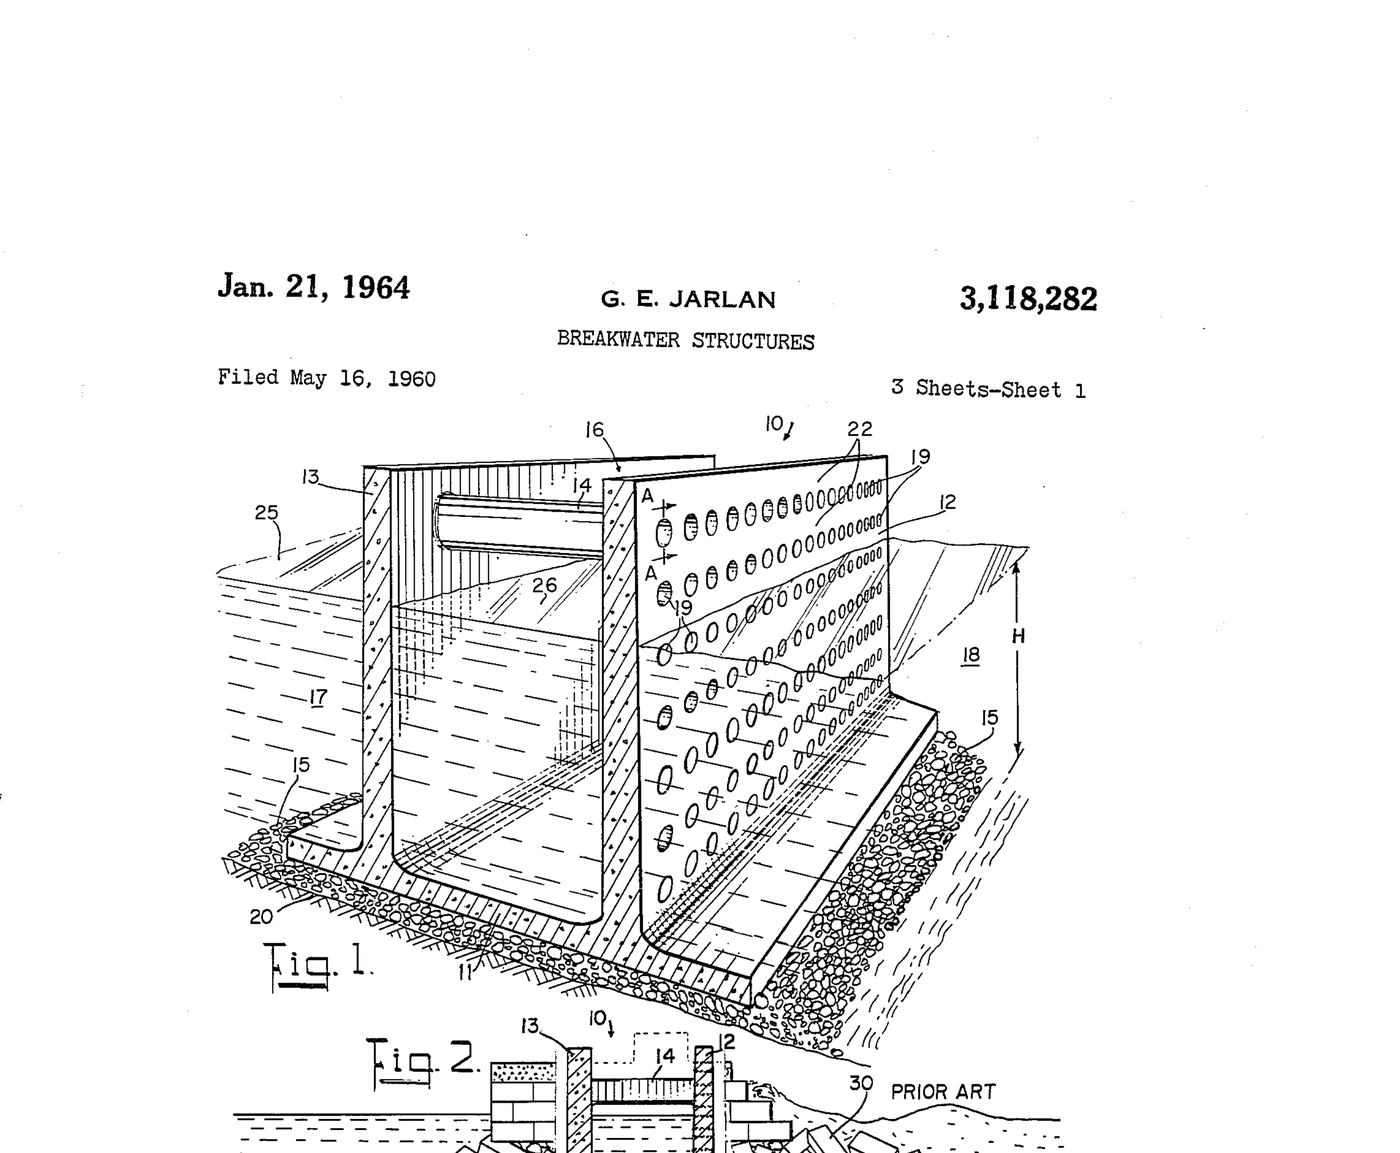
US 3,118,282 (Jarlan, granted 21 Jan 1964), sheet 1 — public domain. Fig. 1 is the wall. Fig. 2 is the same footprint against a rubble mound.
What the papers say
primary Jarlan 1961, patent US 3,118,282. Perforated front ~40–60% open, chamber 0.05–0.15 of an 8 s deep-water wavelength.
field First build Baie-Comeau, Québec, 1962: nine concrete caissons, 3 ft holes, empty chamber. NRC strain-gauged one panel in service (Dryburgh 1967).
peer-reviewed Fugazza & Natale 1992: closed-form design; one chamber is the most effective in the practical range. Suh 2001: reflection minimum near B/L ≈ 0.2, falls as steepness rises.
peer-reviewed Medina / Garrido 2010–2012, 1,500 UPV flume runs: CR < 0.6 for 0.1 < B/L < 0.3; lowest at 20–30% open; slots and round holes alike at the same open %.
contested Patent (50% open, B/L 0.05–0.15) vs flume (20–30% open, B/L 0.1–0.3). Both stay on the page. Linear theory goes below CR 0.3; this calculator floors Kr at 0.3. No electrolytic Jarlan has been measured.
How it is computed
derived Chamber: screen at x = 0, solid wall at x = B, propagating mode only. Screen condition ik(φ₁ − φ₂) = (F − iS) ∂φ/∂x with F = 2T|1 − R| (Kriebel’s linearised loss, T from the Physics page) and S = kD/P (fluid inertia in the holes). R = (Z − 1)/(Z + 1), Z = F + i(cot kB − S). Resonance at cot kB = S; full absorption at F = 1.
derived Loads: screen q = ρg(H/2)|F − iS||1 − R|; back wall q = ρg(H/2)|1 − R|/|sin kB|; plain wall ρgH. Search: front open 15–40%, B/L 0.06–0.30, for minimum R; then each cage is cost-optimised exactly as the single wall on Home, back cage with P = 0.
peer-reviewed Rock mound at the same sea: d’Angremond 1997 Kt = −0.4 Rc/H + 0.64 (B/H)−0.31(1 − e−0.5ξ); Zanuttigh & van der Meer 2008 Kr = tanh(0.12 ξ0.87). Mass: 2.3 m trapezoid, 3 ft crest, 2H:1V, 1.85 t/m³.
Not priced: marine installation, anodes, rectifiers and cabling, toe support, scour, design and permits. Regular waves, no breaking on the wall, no overtopping.
Sources
Jarlan, G.E. 1961. A perforated vertical wall breakwater. The Dock and Harbour Authority 41(486) 394–398; US 3,118,282, granted 21 Jan 1964
Marks, W., Jarlan, G.E. 1968. Experimental studies on a fixed perforated breakwater. ICCE 11, 1121–1140. doi:10.9753/icce.v11.71
Dryburgh, R.B., Peter, B.G., Plewes, W.G. 1967. Strain measurements on perforated breakwater at Baie Comeau. NRC
Fugazza, M., Natale, L. 1992. Hydraulic design of perforated breakwaters. J. Waterway, Port, Coastal, Ocean Eng. 118(1), 1–14
Suh, K.D., Choi, J.C., Kim, B.H., Park, W.S. 2001. Reflection of irregular waves from perforated-wall caisson breakwaters. Coastal Engineering 44, 141–151
Garrido, J.M., Medina, J.R. 2012. New neural network-derived empirical formulas for estimating wave reflection on Jarlan-type breakwaters. Coastal Engineering 62, 9–18. doi:10.1016/j.coastaleng.2011.12.003
Pereira, Teh, Manoharan, Lim 2018. Design optimization of a porous box-type breakwater. MATEC Web Conf. 203, 01018 — optimum P ≈ 35%, B/L ≈ 0.23
d’Angremond, K., van der Meer, J.W., de Jong, R.J. 1997. Wave transmission at low-crested structures. ICCE 25
Zanuttigh, B., van der Meer, J.W. 2008. Wave reflection from coastal structures in design conditions. Coastal Engineering 55(10), 771–779
USACE Philadelphia 2022. Mordecai Island feasibility study — Table ES.1 cost; §3 STWAVE waves 0.3–1.5 ft, Tp 2–2.5 s; §4.1 waves 1.5–3 ft wind and boat wake; Table 3.5 datums; 7.6 ft structure, 3 ft crest, 2H:1V, geocomposite, 1 ft overbuild
Kerr, Brown, Miller 2020. Stevens Institute SIT-DL-20-9-CV5 — Gardner’s Basin bids, sheet pile replaced 2060–80, 5% damage at 50-yr storm, 10% ice allowance on rock